

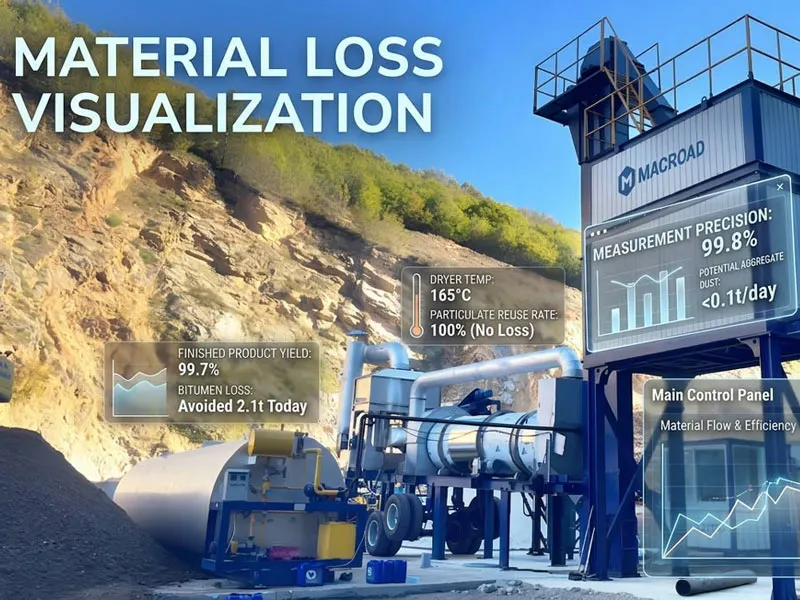
In actual production and construction processes, material loss is an ever-present reality, yet it is rarely subjected to detailed scrutiny. In most instances, we observe only the aggregate result of this loss, finding it difficult to answer a more specific question: at precisely which stages did these losses occur?
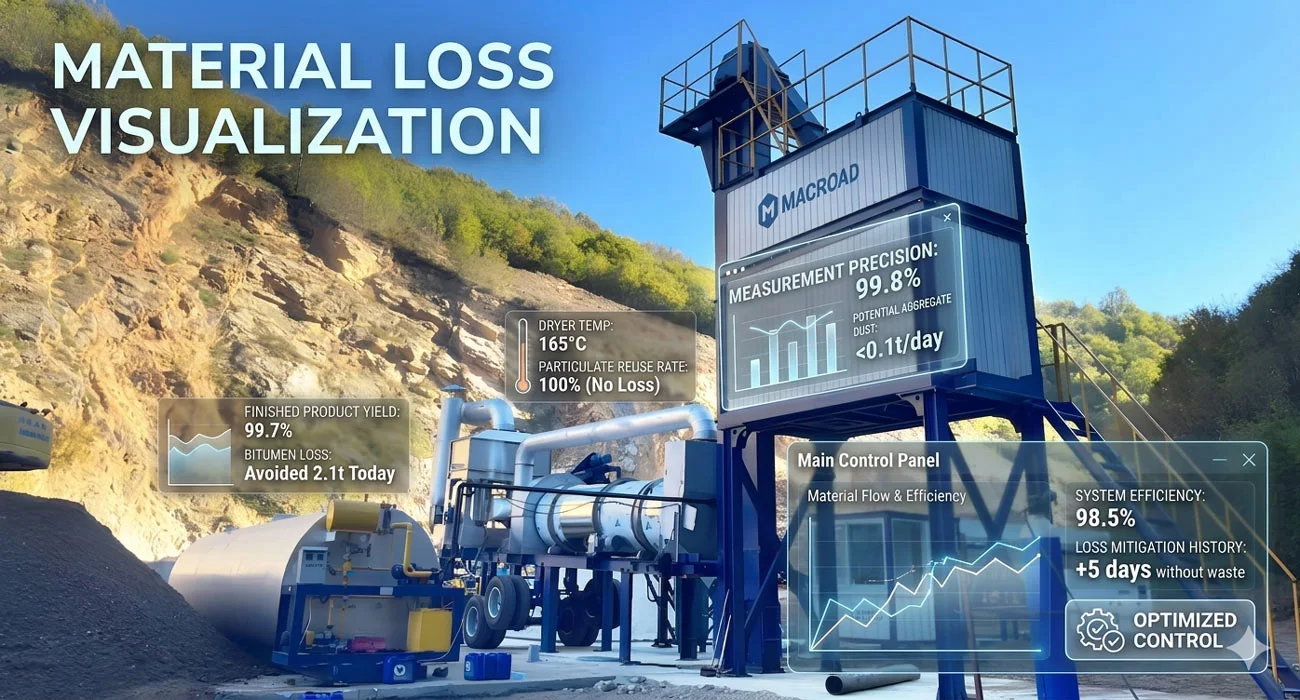
Did they stem from deviations in upstream material batching, or from fluctuations within the intermediate production process? Were they caused by changes in equipment operating conditions, or by the dynamics of the construction workflow? When these questions cannot be clearly answered, the loss itself becomes virtually impossible to effectively manage. It is precisely in this context that the concept of loss visualization has been introduced: by recording and disaggregating data from each individual stage, what was once an amorphous, generalized figure for total loss is broken down and revealed as specific variations occurring within concrete operational processes.
From Results to Process: Where Does Material Loss Actually Occur?
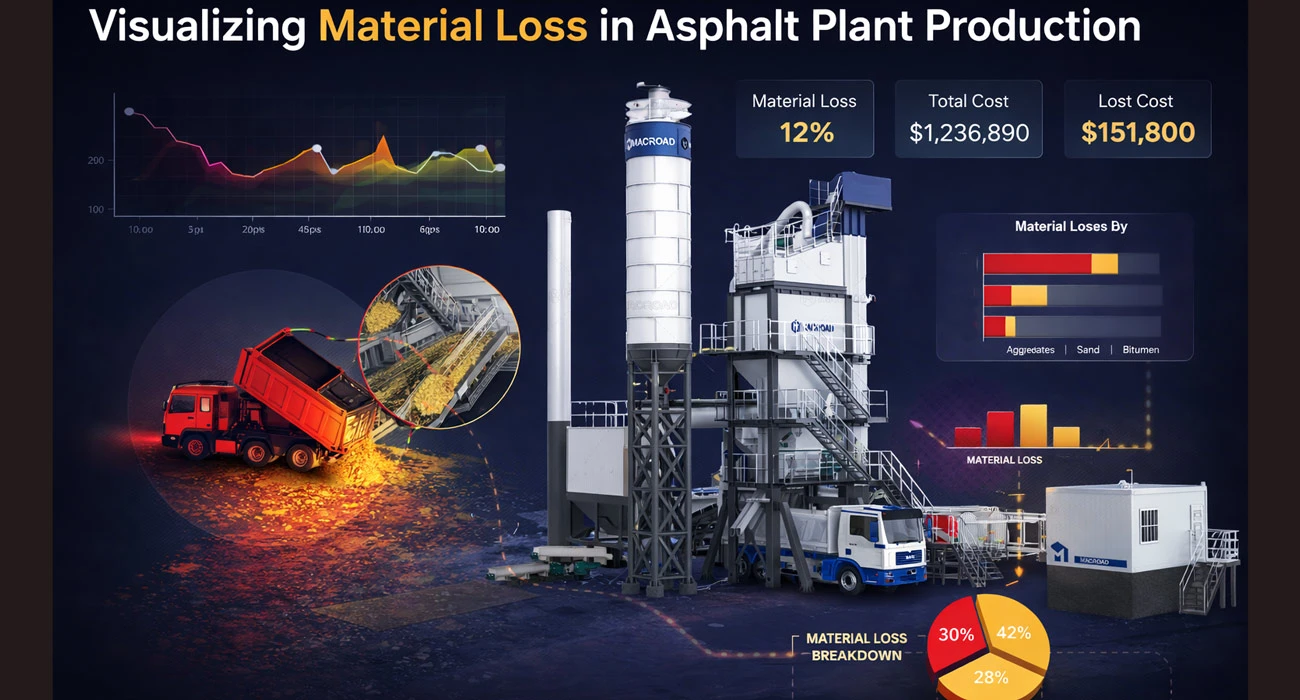
During the operation of an asphalt mixing plant, material loss is an ever-present phenomenon that permeates multiple stages of the process. The challenge, however, lies in the fact that these losses rarely manifest directly or in an obvious form; instead, they are dispersed across various operational systems and embedded within specific technical procedures and operational workflows. Precisely for this reason, many instances of material loss are not—as it might seem—non-existent, but rather simply difficult to identify.
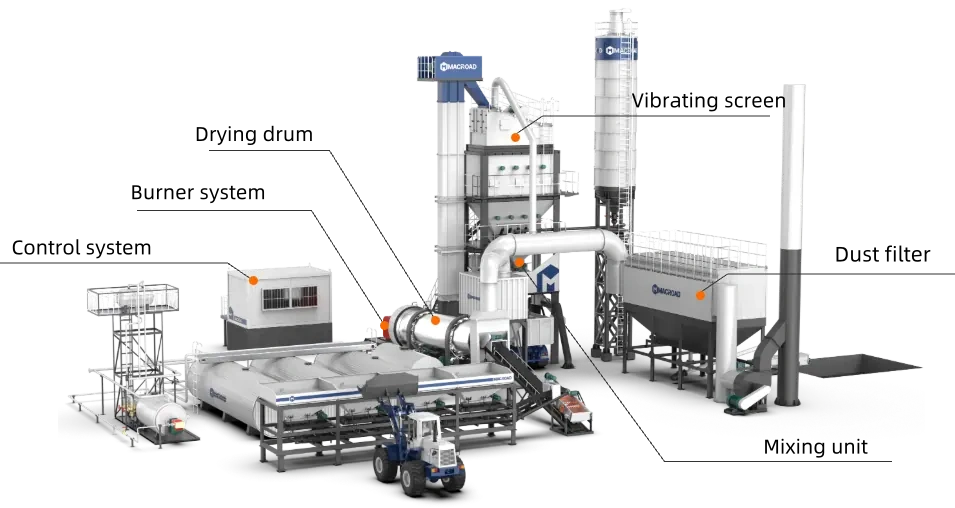
Cold Feed and Feeding System: The Starting Point for Amplified Initial Deviations
- Moisture Content Fluctuations → Reduction in Actual Effective Material: Inconsistent moisture levels across different material batches reduce the actual quantity of effective aggregate participating in production; however, metering remains based on total weight, resulting in a hidden loss.
- Uneven Feeding → System Supply Fluctuations: Instability in feeding speed or uniformity disrupts the operational rhythm of downstream systems, thereby compromising overall material utilization efficiency.
- Front-End Metering Deviations → The Source of System-Wide Errors: Once a deviation occurs during initial metering, all subsequent processing stages operate based on this existing error, leading to a gradual amplification of material losses throughout the entire process.
Drying and Heating System: Dual Impact on Energy Consumption and Material State
- Temperature Control Deviations → Abnormal Material State: Heating temperatures that are either too high or too low alter the physical properties of the materials, rendering certain portions unfit for use according to established standards.
- Combustion Efficiency Fluctuations → Increased Energy Consumption: Unstable combustion increases the energy required per unit of output while simultaneously diminishing drying efficiency.
- System Instability → Downstream Process Instability: Fluctuations in temperature and heating conditions directly compromise the stability of subsequent screening and mixing operations.
Screening and Hot Aggregate System: The Stage Where Structural Losses Are Amplified
- Screening Efficiency Deviations → Gradation Distortion and Material Misclassification: When screening efficiency is inconsistent, materials of different particle sizes cannot be accurately separated; some materials are misclassified or recirculated, resulting in deviations from the required aggregate gradation.
- Uneven Hot Aggregate Distribution → Reduced Material Utilization: Uneven distribution or unstable discharge of hot aggregate triggers deviations during subsequent batching operations; the system requires additional adjustments to match the target mix design, thereby incurring hidden losses.
- Recirculation and Overflow → Consumption Caused by Reprocessing: Materials that are not utilized in a timely manner undergo repeated processing cycles within the system, consuming both time and energy without contributing to effective output—a form of hidden loss.
Mixing and Metering System: The Stage Where Precision Errors Accumulate
- Metering Errors → Deviation from Design Mix Ratios: Even minor deviations during the weighing process directly cause the proportions of individual materials to diverge from the intended design values, establishing an initial error within the mix.
- Accumulation of Errors → Automatic System Compensation via Additional Material Input: To correct deviations in the mixing ratio, the system often executes compensatory adjustments; this results in increased material input and amplifies overall material loss.
- Uneven Mixing → Inefficient Local Material Utilization: Insufficient mixing leads to portions of the material remaining unutilized; this subsequently results in quality fluctuations or material waste during downstream application.
Transport and Construction Phases: The Stages of Final-State Degradation
- Temperature Degradation → Deterioration of Material Performance: A drop in material temperature during transport can compromise workability, rendering certain portions of the material unfit to meet required application standards.
- Time Delays → Alteration of Material State: Prolonged waiting periods cause the material’s properties to undergo gradual changes, thereby reducing its effective utilization rate.
- Mismatched Construction Pace → Rework and Excess Consumption: A misalignment between the construction schedule and the material supply flow can necessitate rework or result in material wastage, ultimately contributing to final material loss.
Viewed across the entire operational process, material loss is not concentrated within a single stage but is instead distributed across multiple systems, accumulating gradually as operations proceed. Crucially, these losses often manifest in forms that are extremely minute and diffuse; they do not trigger obvious anomalies within any single stage, nor are they easily or accurately identifiable through mere experience or visual inspection.
It is precisely against this backdrop that the visualization of material loss has emerged as a critical area of focus—it renders visible those operational details that were previously fragmented, thereby fundamentally reshaping our understanding of how such losses occur.
Why Material Loss Persists and Remains Difficult to Visualize
If the value of loss visualization lies in bringing problems into sharp focus, then a more critical question arises: Why is it that, in the past, these losses persisted for so long without ever being truly revealed?
The answer is not complex: it was not that the losses did not exist, but rather that the technological conditions and equipment capabilities available at the time were insufficient to support the detailed analysis and interconnection of these processes.
Technical Capabilities: Data Insufficient to Reconstruct Processes
- Limited Data Granularity; Inability to Capture Operational Details: Data collection often reflects only final outcomes and fails to reconstruct the specific changes occurring during intermediate stages, making it impossible to trace the root causes of losses.
- Fragmented Data Systems; Inability to Form a Complete Chain: Data across different systems often exists in isolation, lacking a unified data structure and interconnection mechanisms. Consequently, data from various stages cannot flow seamlessly, preventing a holistic, system-level visualization of losses.
- Lack of Real-time Data; Inability to Capture Dynamic Changes: Most data relies on retrospective recording rather than real-time capture. This means that fluctuations occurring during operations cannot be recorded promptly, resulting in loss assessment remaining largely a matter of subjective experience rather than objective data analysis.
Equipment Capabilities: Limited Operational Precision and Coordination
- Limited Equipment Control Precision; Difficulty Supporting Fine-Grained Management: In legacy equipment systems, operational control tends to focus on broad, holistic adjustments rather than precise control over specific individual stages. This control approach makes it difficult to isolate and identify subtle deviations.
- Insufficient System Coordination; Lack of Cross-Stage Linkage: Different pieces of equipment often operate relatively independently, lacking mechanisms for inter-linkage. When a deviation occurs in one stage, the system as a whole cannot respond or self-correct; consequently, the problem remains confined to a localized area.
- Insufficient Equipment Operational Stability; Compromised Data Reliability: If the equipment itself suffers from inherent instability—such as weighing errors or temperature control fluctuations—then even if data is recorded, its underlying reliability is compromised, further undermining the foundation for loss analysis.
Industry Environment: Management Practices and Requirements Have Yet to Drive Visualization
- Industry Focus Skews Toward Outcome Compliance, Not Process Control: Under traditional models, as long as the final output meets basic requirements, losses occurring during the intermediate process are rarely investigated in depth. This outcome-oriented mindset creates a lack of incentive to actively manage process-related data.
- Insufficient Standards and Regulations; Lack of Requirements for Data-Driven Management: Historical industry standards and regulations have tended to focus primarily on safety and quality outcomes, with fewer requirements regarding the granular management of process data and losses. Consequently, enterprises lack the external impetus to establish systematic data management capabilities.
- Management Relies on Experience; Low Degree of Data-Driven Decision-Making: Many decisions are based on the operational experience of personnel rather than on data analysis. In this paradigm, even if data exists, it is not fully utilized; naturally, this makes it difficult to systematically identify and address losses.
Taken as a whole, the reason material loss has long persisted yet remained difficult to visualize is not attributable to a single factor; rather, it is the result of the combined interplay of technical capabilities, equipment capabilities, and the broader industry environment. When these foundational conditions are not yet in place, loss exists primarily in the form of experiential knowledge, proving difficult to deconstruct into data-driven processes that can be continuously monitored and analyzed.
However, as these conditions gradually mature, the groundwork for rendering such losses visible begins to take shape—thereby establishing the practical prerequisites for the emergence of loss visualization.
Cognitive Shifts Driven by Material Loss Visualization
As material loss begins to be progressively revealed, the initial shift occurs in the very way the problem is conceptualized. In the past, loss was predominantly observed as an aggregate outcome; however, under conditions of visualization, this singular mode of perception is gradually being deconstructed.
As data becomes capable of being segmented and tracked, the focus of understanding shifts from merely observing results to comprehending the underlying processes—thereby establishing a new foundation for subsequent management and optimization.
| Traditional Understanding | Cognitive Dimension | Understanding with Loss Visualization |
| Loss is usually seen as an overall result, focusing on total loss values without breaking down sources or formation paths. | Understanding of Loss | Loss is decomposed into specific stages, such as batching, heating, screening, and mixing, forming a continuous process that is easier to understand and track. |
| Issues are often noticed only after results appear, leading to lag in detection. | Observation Timing | Deviations can be observed in real time during operation, allowing earlier problem detection. |
| Relies on operator experience and intuition, highly subjective. | Basis for Judgment | Judgments are based on data trends, providing stable and quantifiable insights, reducing reliance on personal experience. |
| Only overall anomalies can be identified; specific stages are hard to pinpoint. | Problem Localization | Problems can be traced to specific systems or steps, enabling precise tracking. |
| Result-oriented management; process changes are rarely addressed. | Management Approach | Management shifts to process monitoring, allowing interventions during operations to reduce losses. |
| Data mainly used for recording and statistics, referenced after the fact. | Use of Data | Data is actively used for analysis and decision-making, becoming a key tool for operation and optimization. |
| Systems operate relatively independently, with unclear interconnections. | System Understanding | System data can be linked; operations can be analyzed holistically. |
| Relies on experience-based adjustments, which are less consistent. | Optimization Approach | Dynamic optimization based on data, with more targeted and controllable adjustments. |
| Focuses on surface-level results; lacks insight into processes. | Cognitive Scope | Provides visibility into process fluctuations and trends, extending understanding to the operational level. |
Through loss visualization, material loss is no longer merely an abstract final outcome, but rather a process that can be deconstructed, tracked, and understood. This cognitive shift enables managers and operators to identify issues earlier and grasp causal relationships more clearly, thereby providing a solid foundation for subsequent optimization and decision-making. In other words, the primary value delivered by loss visualization lies precisely in reshaping—at a cognitive level—the way in which loss is perceived.
Reshaping Production Systems Through Material Loss Visualization
Once material wastage becomes visible, system operation ceases to be merely the mechanical execution of commands. Data from every stage can be tracked, and every deviation can be detected in real time. The production system begins to function as a sentient entity—one that not only executes operations but also proactively self-adjusts, rendering the entire process more flexible and efficient.
Under these conditions, the operational dynamics of every system undergo a marked transformation; spanning everything from control and data to processes and collaboration, every component is evolving toward greater dynamism and intelligence.
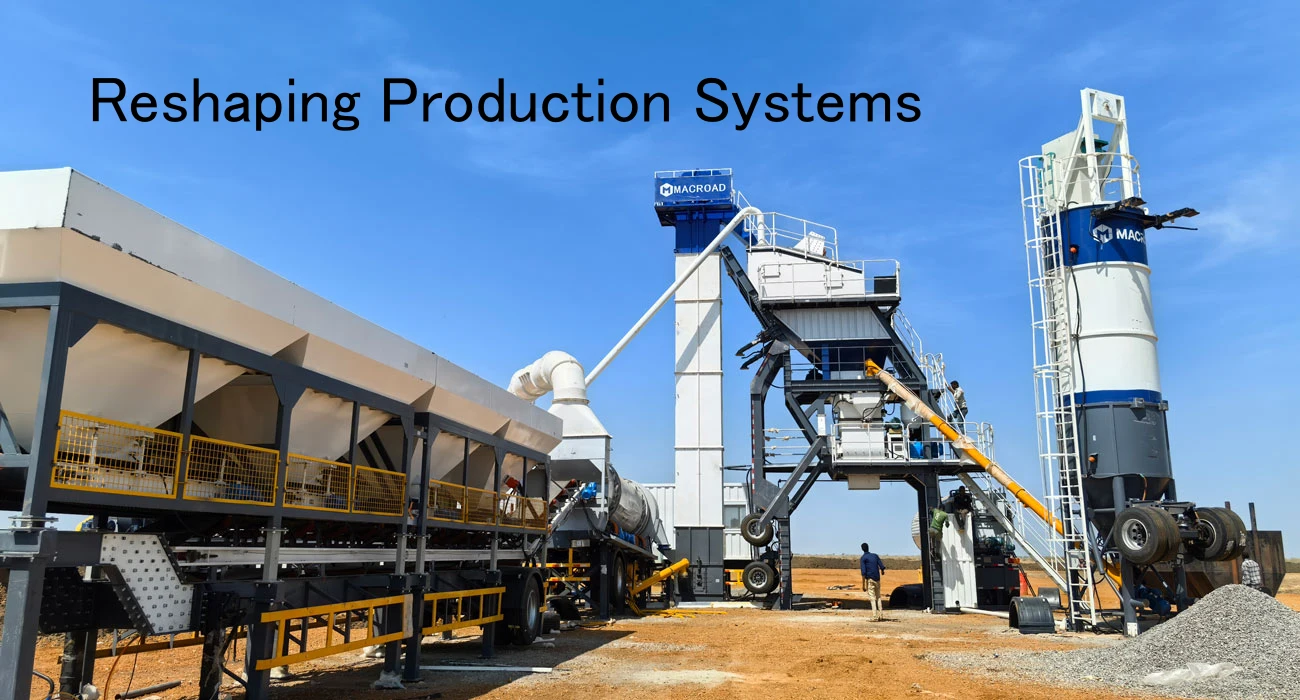
Control System: From Execution Tool to Regulatory Hub
- Real-time Deviation Response: The control system is no longer merely an executor of preset programs; instead, it collects data from every stage in real time, automatically adjusting for deviations to ensure operational stability.
- Proactive Production Regulation: By analyzing both historical and real-time data, the system can anticipate potential issues and intervene preemptively, transforming control from passive execution into proactive regulation.
- Multi-Stage Coordination: The control system simultaneously manages batching, heating, mixing, and conveying processes, achieving optimized linkages between stages rather than relying on isolated, single-point operations.
Data System: From Recording Tool to Decision Engine
- Real-time Data Acquisition: Data from every stage is collected synchronously during the production process, making operational fluctuations immediately visible rather than merely serving as retrospective statistics.
- Data-Driven Production: Data serves not only to record results but also to dynamically adjust parameters—such as mix ratios, temperatures, and mixing speeds—enabling agile, data-driven production decisions.
- Analysis and Optimization Loop: Through multi-stage data analysis, the system identifies issues and opportunities for improvement, facilitating continuous process enhancement and effective loss control.
Production Workflow: From Fixed Sequence to Dynamic System
- Flexible Process Adjustment: Production no longer adheres strictly to a fixed sequence; the system can adjust the pace based on real-time data to adapt to variations in raw materials and specific project requirements.
- Automated Anomaly Handling: If an anomaly occurs at any stage, the system automatically adjusts subsequent stages to mitigate the risk of escalating losses or potential downtime.
- Holistic Efficiency Enhancement: The dynamic workflow ensures tight integration across all stages, minimizing idle time and bottlenecks while maintaining consistent output levels and optimal material utilization.
Management and Optimization: From Experience-Driven to Data-Driven
- Real-time Monitoring and Early Warning: Managers gain real-time visibility into data fluctuations across all stages, receiving early warnings regarding potential deviations to reduce the burden of retrospective troubleshooting.
- Data-Informed Decision-Making: Decisions are no longer based solely on intuition or experience, but are instead grounded in visualized data and analytical insights, making management more scientific and quantifiable.
- Continuous Optimization Capability: Based on data feedback, the system continuously refines process parameters and production strategies, driving long-term improvements in operational efficiency and material utilization.
Through the visualization of material loss, the production system transcends the status of a mere mechanical assembly line, evolving instead into a dynamic entity that is sentient, adaptable, and capable of self-optimization. The control system serves as the central regulatory hub, with data driving production decisions and facilitating collaborative operations within this new procedural framework; concurrently, managers gain the ability to maintain a real-time, comprehensive overview of the entire operation.
This transformation not only enhances production efficiency but also renders loss management and process optimization into sustainable and quantifiable processes.
Material Loss Visualization Drives Process and Technology Upgrades
When material loss can be precisely monitored and visualized, new possibilities emerge for process and technical optimization. Deviations, fluctuations, and inconsistent material usage are no longer overlooked; instead, production stages can be finely tuned based on real-time data, thereby enhancing material utilization, optimizing ratios, and achieving more stable process operations.